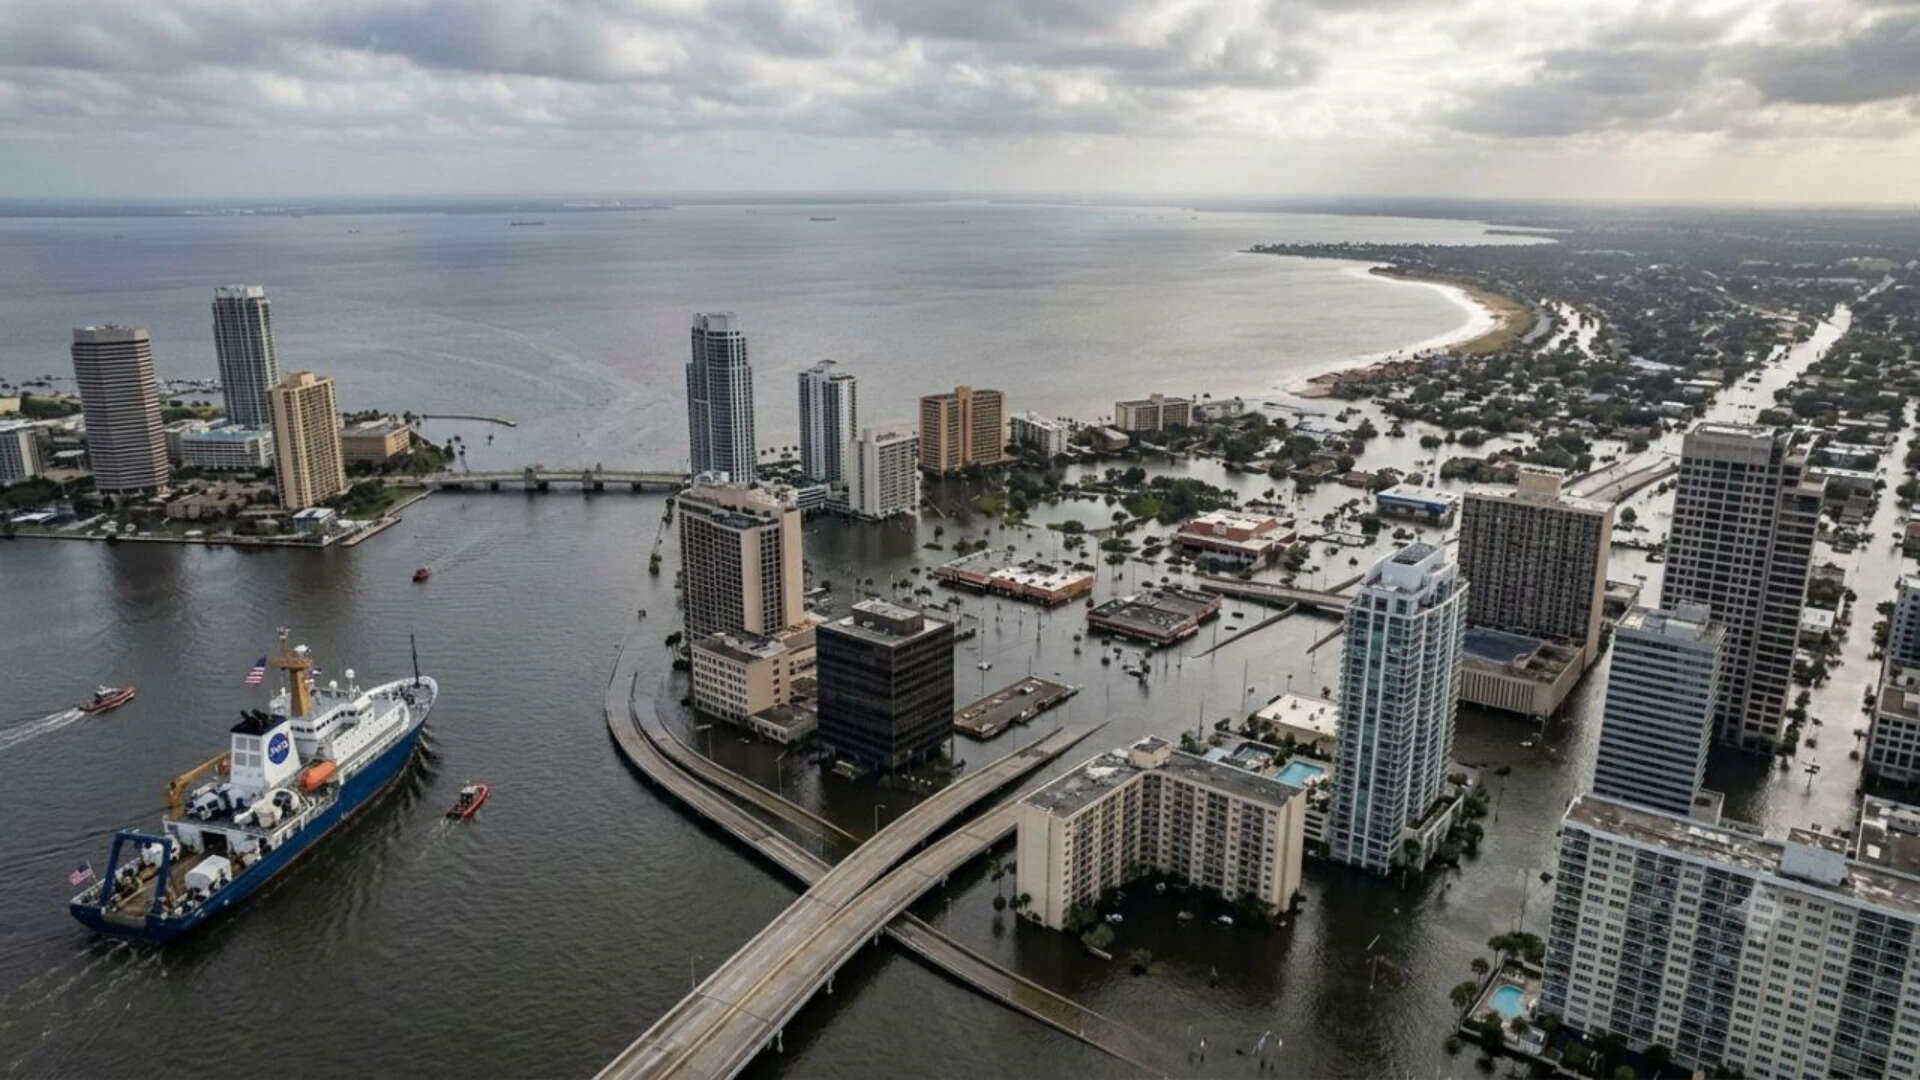
The warning that dozens of US coastal cities could face severe inundation by 2050 is frequently presented as a simple matter of rising tides overflowing shorelines. This standard narrative, popularized by simplified interpretations of satellite altimetry and climate models, relies on a fundamentally flawed premise: the "bathtub model." By assuming that sea-level rise is uniform and that land surfaces are static, standard risk assessments fail to account for the compounding local variables that dictate whether an asset remains dry, becomes chronically wet, or becomes structurally unviable long before the tide reaches its foundations.
To accurately quantify the risk of coastal inundation over the next 25 years, capital allocators, civil engineers, and policymakers must abandon binary "underwater" projections. Instead, they must evaluate the highly localized, non-linear physical and financial mechanisms that govern relative sea-level rise.
The Three Pillars of Relative Sea-Level Rise
Global mean sea level (GMSL) is an average metric with limited utility for local planning. To determine actual risk at a municipal or parcel level, we must calculate Relative Sea-Level Rise (RSLR). This metric is governed by three distinct physical pillars:
$$RSLR(t) = \Delta eustatic(t) + \Delta oceanographic(t) - VLM(t)$$
Where:
- $\Delta eustatic(t)$ represents global eustatic changes (ocean mass addition from melting ice sheets and thermal expansion).
- $\Delta oceanographic(t)$ represents localized ocean height variations caused by shifts in currents, wind patterns, and water density.
- $VLM(t)$ represents Vertical Land Motion, where positive values denote tectonic uplift and negative values denote subsidence (sinking land).
1. Eustatic Drivers and Thermal Inertia
Eustatic rise is locked in for the near term. Because of the thermal inertia of the oceans—the delay between atmospheric warming and the absorption of that heat by deep ocean waters—the projected 10 to 12 inches of average US sea-level rise by 2050 will occur regardless of current emissions mitigation strategies. The uncertainty in 2050 models is surprisingly low; the divergence between high-emissions and low-emissions scenarios only becomes structurally significant after 2060.
2. Oceanographic Deviations and Mass Distribution
Sea level is not flat. Gravitational attraction pulls ocean water toward massive ice sheets. As the Greenland ice sheet melts, its gravitational pull weakens, causing water to redistribute away from the Arctic and pile up along the US East Coast. Simultaneously, changes in major ocean currents alter local sea levels. The slowing of the Atlantic Meridional Overturning Circulation (AMOC) reduces the transport of water away from the North American coast, effectively piling up water along the Atlantic Seaboard and amplifying local sea-level rise beyond the global average.
3. Vertical Land Motion: The Silent Accelerator
Vertical Land Motion (VLM) is the most critical and overlooked variable in the inundation equation. While global sea levels rise at approximately 3 to 4 millimeters per year, some US coastal cities are sinking at double or triple that rate. This subsidence is driven by two primary factors:
- Compaction of Sedimentary Basins: Deltaic regions, such as the Mississippi River Delta (New Orleans) and the Texas Gulf Coast (Galveston, Houston), sit on thick layers of fine-grained sediment that naturally compact over time under their own weight.
- Fluid Extraction: The extraction of groundwater for municipal use, as well as oil and gas extraction, depressurizes subsurface reservoirs. This leads to rapid compaction of clay layers and dramatic surface subsidence.
The Failure of the Bathtub Model and Subsurface Infrastructure Decay
The most pervasive analytical error in public flood maps is the reliance on hydrostatic "bathtub" modeling. This approach simply overlays a projected sea-level elevation onto a digital elevation model (DEM) and assumes everything below that line is flooded. This methodology ignores crucial hydrological and structural realities.
The Ground-Up Attack: Water Table Shoaling
Long before saltwater spills over a seawall, rising sea levels push the local freshwater table upward. Because fresh water is less dense than saltwater, it floats on top of the saline marine water table in coastal aquifers. As sea level rises, it lifts this freshwater lens toward the surface.
[ Inland Land Surface ]                      [ Ocean Surface ]
        |                                           |
        |   === Freshwater Table (Shoaling) ===     |~~~~ High Tide
        |   -----------------------------------     |
        |   === Saline Water Table (Rising) ===     |~~~~ Low Tide
        v                                           v
[ Subsurface Infrastructure (Pipes, Basements, Foundations) ]
This process, known as water table shoaling, causes immediate structural and municipal complications:
- Loss of Soil Bearing Capacity: As soils become saturated, their shear strength decreases, compromising the structural integrity of shallow foundations and roadbeds.
- Subterranean Intrusion: Basements, parking structures, and utility conduits are subjected to hydrostatic pressure they were not engineered to withstand, leading to chronic leakage and flooding.
- Sanitary Sewer and Stormwater Failure: Rising water tables infiltrate cracked gravity-fed sewer pipes, overwhelming wastewater treatment plants during dry weather. Stormwater outfalls, designed to discharge runoff into the ocean via gravity, become submerged, causing inland rainfall to pool on streets even on sunny days.
Concrete Degradation via Halite and Sulfate Ingress
Subsurface infrastructure in shoaling zones faces chemical destruction. As saltwater encroaches into previously freshwater aquifers, buried concrete infrastructure (foundations, pilings, water mains) is exposed to high concentrations of chlorides and sulfates.
Chlorides penetrate the porous matrix of concrete and attack the passive oxide protective layer on steel rebar. Once this layer is breached, the steel rusts. Because rust occupies up to six times the volume of the original steel, it exerts immense internal tensile pressure on the concrete, leading to cracking, spalling, and eventual catastrophic structural failure.
The Financial Transmission Mechanism: When Assets Die Before the Water Arrives
The economic obsolescence of coastal real estate will occur years before permanent physical inundation. The transition from high-value asset to stranded liability is driven by a predictable sequence of financial shocks.
+---------------------------------------------------------+
| PHASE 1: Insurance Retraction                           |
| Private insurers exit or raise premiums to unviable levels |
+---------------------------------------------------------+
                            |
                            v
+---------------------------------------------------------+
| PHASE 2: Debt Market Disruption                         |
| Lenders refuse 30-year mortgages; buyers require cash   |
+---------------------------------------------------------+
                            |
                            v
+---------------------------------------------------------+
| PHASE 3: Municipal Credit Degradation                   |
| Sinking tax base + rising infrastructure costs = junk bonds|
+---------------------------------------------------------+
                            |
                            v
+---------------------------------------------------------+
| PHASE 4: Terminal Valuation Collapse                    |
| Liquid assets devalued; property owners face abandonment |
+---------------------------------------------------------+
1. The Insurance Feedback Loop
Insurance markets act as the primary pricing mechanism for climate risk. Private insurers operate on one-year policy cycles, allowing them to adjust premiums rapidly in response to updated risk models. As localized flood frequencies increase, insurers react in two steps:
- Premium Escalation: Deductibles are increased and premiums are raised to reflect the actuarial reality of frequent, minor "nuisance" flooding.
- Market Retraction: Once a ZIP code reaches a threshold of chronic risk, major carriers withdraw entirely, leaving property owners dependent on state-backed insurers of last resort. These state entities typically offer highly restricted coverage limits at exorbitant rates.
2. Debt Market Disruption
The standard US residential real estate market is built on the 30-year fixed-rate mortgage. This financial instrument requires the underlying asset to maintain its structural and economic value for three decades.
If a property faces a high probability of chronic flooding or loss of utility by 2050, rational lenders will refuse to underwrite a 30-year loan today. As commercial banks tighten lending standards, buyers must secure larger down payments or turn to non-conforming, higher-interest loans. This contraction in available credit immediately depresses property values, as the pool of eligible buyers shrinks to cash-only investors demanding deep discounts.
3. Municipal Credit Contraction and Tax Base Degradation
Coastal municipalities rely heavily on property taxes to fund municipal operations and service debt. This creates a fiscal vulnerability:
- The Valuation Squeeze: As coastal property values decline due to rising insurance costs and restricted credit, the municipal tax base shrinks.
- The Capital Expenditure Surge: Simultaneously, the municipality must issue debt to fund defensive infrastructure (pump stations, seawalls, raised roadways).
- The Rating Agency Response: Rating agencies evaluate a city’s capacity to service debt against its projected tax base and climate exposure. When credit ratings are downgraded, the cost of borrowing increases, creating a feedback loop where the city must pay more to borrow money just as its tax revenues are declining.
Regional Risk Profiles: A Comparative Vulnerability Matrix
The risk profile of US coastal cities is highly regional, defined by geological history, oceanography, and local infrastructure design.
The Gulf Coast (High Vulnerability, High Subsidence)
The Gulf Coast, particularly Louisiana and Texas, represents the most urgent risk profile. Eustatic sea-level rise is heavily compounded by rapid subsidence caused by historical groundwater extraction, oil and gas withdrawal, and deltaic sediment compaction. The flat topography means minor increases in relative sea level translate into vast geographic areas of inland migration. Municipalities here are highly vulnerable to storm surge events, which ride on top of an elevated sea-level baseline.
The Southeast Atlantic Coast (Moderate-High Vulnerability, Porous Geology)
From North Carolina down to Florida, the risk is amplified by geological constraints. South Florida sits on a porous limestone plateau. This geologic structure renders traditional defensive infrastructure, such as seawalls and dikes, largely ineffective.
Water simply flows through the porous rock underneath the seawalls, rising up from the ground behind the defenses. Consequently, South Florida cannot easily build its way out of water table shoaling, making its real estate market exceptionally vulnerable to structural decay and chronic street flooding.
The Northeast Atlantic Coast (Moderate Vulnerability, Oceanographic Anomalies)
The Northeast US, including New York, Boston, and Baltimore, is experiencing relative sea-level rise that exceeds the global average due to the slowing of the Gulf Stream and AMOC. However, these cities generally benefit from higher elevations relative to the Gulf Coast and have access to deeper capital markets to fund massive civil engineering interventions. The primary threat here is concentrated in legacy subway systems, subterranean utility corridors, and historic waterfront districts.
Asset-Level Risk Mitigation: A Framework for Capital Allocation
To navigate the 2050 coastal transition, real estate investors, infrastructure funds, and corporate treasurers must deploy a rigorous screening framework that looks beyond simple elevation metrics.
[ Real Estate / Infrastructure Portfolio ]
                   |
                   v
      +-------------------------+
      |  STEP 1: Geo-Location   | ---> Match high-resolution LiDAR (1m)
      +-------------------------+      against local relative SLR curves.
                   |
                   v
      +-------------------------+
      |  STEP 2: Geotechnical   | ---> Identify porous limestone, clay compaction,
      +-------------------------+      and historic fill zones.
                   |
                   v
      +-------------------------+
      |  STEP 3: Municipal CapEx| ---> Assess city's debt capacity and willingness
      +-------------------------+      to fund protective infrastructure.
                   |
                   v
      +-------------------------+
      |  STEP 4: Asset Utility  | ---> Analyze critical access roads, power stations,
      +-------------------------+      and wastewater networks serving the asset.
Screen for Geotechnical Foundation Profiles
Do not buy real estate based on surface elevation alone. Analyze the underlying soil and rock.
- Avoid assets built on historic fill or high-compaction clay basins, which will experience accelerated local subsidence.
- Prioritize assets built on stable bedrock, where the local vertical land motion is zero or slightly positive.
- Examine the foundation design of existing structures; deep pilings anchored into bedrock are resilient against soil shear failures, whereas shallow slab-on-grade or crawlspace foundations are highly vulnerable to water table shoaling.
Stress-Test Municipal Capital Capacity
An asset is only as viable as the municipal infrastructure that supports it. If a commercial building remains dry because it is built on high ground, but the roads leading to it are flooded 50 days a year, the asset's economic utility is zero.
- Review the municipal debt load and credit rating of the local government.
- Determine if the city has a fully funded, politically viable climate adaptation plan.
- Analyze the elevation of critical local infrastructure: power substations, water treatment facilities, and arterial transport corridors. If these public assets are vulnerable, private assets in the vicinity will suffer rapid devaluation regardless of their individual elevation.
Reposition Portfolios Away from Long-Term Debt in High-Risk Zones
For assets located in regions with compounding subsidence and porous geology, capital preservation requires shifting from long-term equity or debt positions to short-term, high-yield operational models. Compress investment horizons from 30 years down to 10 years or less, ensuring capital is fully returned before the local insurance and mortgage markets reach their projected tipping points.