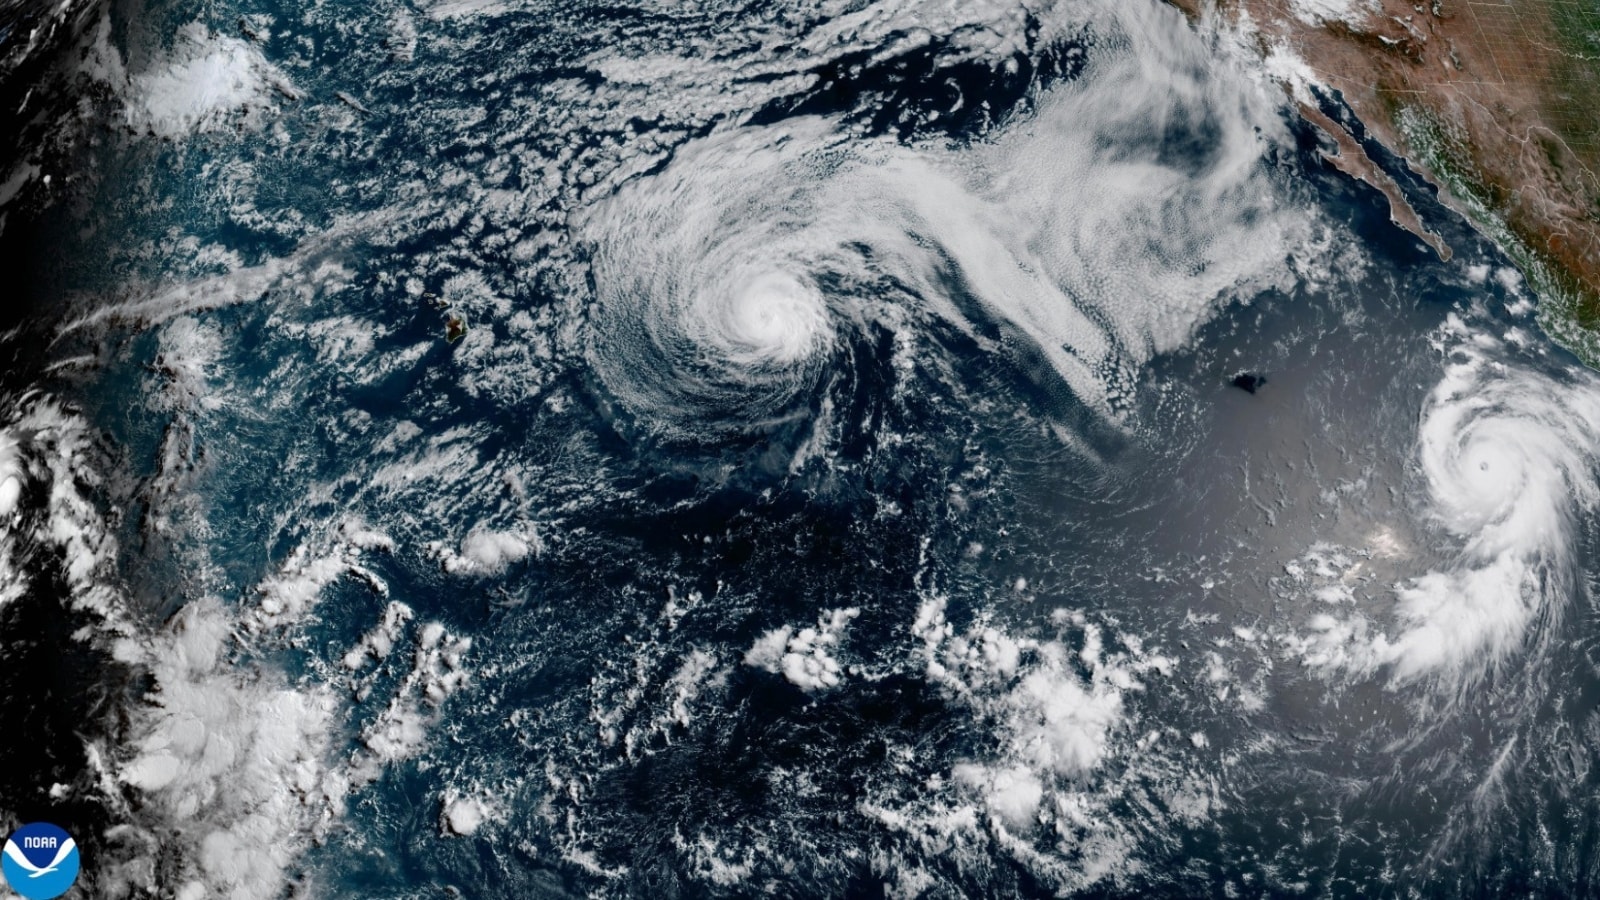
Severe weather events reveal the structural vulnerabilities of regional power grids long before winds peak or storm surges crest. When Hurricane Lala transitioned into a tropical storm while impacting the Hawaiian archipelago, more than 180,000 utility customers lost electricity. This disruption is not merely an unfortunate consequence of nature; it is the predictable outcome of stress testing complex, aging electrical distribution networks against extreme environmental loading variables.
Evaluating this grid failure requires analyzing the event through three distinct operational vectors: environmental loading mechanics, asset vulnerability matrices, and recovery throughput limits. Standard journalistic accounts focus heavily on wind speeds and rainfall totals, yet these metrics fail to explain why localized outages persist long after wind velocities drop below critical thresholds.
Environmental Loading Mechanics and Grid Stress
Tropical cyclones impose multiple distinct physical forces upon electrical infrastructure simultaneously. Wind pressure scales quadratically with velocity, meaning a modest increase in wind speed produces an exponential rise in lateral force applied to utility poles, overhead conductors, and substation transformers.
When Hurricane Lala downgraded to a tropical storm, average sustained wind speeds decreased, but the kinetic energy density remained high enough to sustain structural damage.
Two primary meteorological mechanisms drive infrastructure degradation during such events:
- Dynamic Wind Loading: Variable wind vectors create harmonic oscillations in overhead lines, leading to fatigue failure in hardware connections and insulator strings. Gusts interact with surrounding terrain topography, creating micro-turbulences that exert uneven torque on wooden and concrete support structures.
- Vegetation Vector Interaction: The high moisture content of tropical soils reduces root system anchoring strength. When sustained winds act on dense canopy structures, entire root plates fail rather than individual branches snapping. This causes trees to fall directly across distribution feeders, which represent the highest-volume cause of structural disconnection in island grids.
The Hawaiian grid operates under unique geographical constraints. Unlike continental transmission networks that benefit from vast interconnected loops and redundant tie-lines across multiple states, island systems are isolated entities. They lack infinite capacity buffers. When a primary coastal or valley feeder trips offline, the ability to dynamically reroute power via alternative pathways is severely restricted by geographical bottlenecks and radial distribution topologies.
The Asset Vulnerability Matrix
Electrical grids are systems of components spanning varying vintages of engineering standards. The 180,000-plus outages recorded during the passage of Hurricane Lala exposed the mismatch between legacy infrastructure design parameters and contemporary climate stress patterns.
Utility networks are historically engineered to withstand a specific statistical return interval for wind and rain. When storm intensity exceeds these historical baselines, or when storm duration increases due to forward-speed stalling, components fail systematically.
Overhead Versus Underground Conductor Economics
The debate surrounding subterranean power lines reemerges after every major weather event. Undergrounding eliminates vulnerability to wind-borne debris and tree strikes, yet it introduces distinct engineering failure modes:
- Subsurface Hydrology: Tropical storms deposit massive precipitation volumes over short durations. Underground vaults and duct banks are susceptible to water infiltration, which destroys transformer insulation and induces short circuits in underground switchgear.
- Repair Latency: Locating a fault in an overhead line requires visual inspection from a bucket truck. Locating a fault in an underground cable buried beneath saturated soil requires specialized diagnostic equipment, acoustic testing, and excavation, significantly lengthening Mean Time to Repair metrics.
Utility operators balance capital expenditure against risk mitigation. Retrofitting an entire island grid with underground infrastructure requires multi-billion-dollar investments that would directly impact consumer utility rates. Consequently, hardening strategies must target critical infrastructure nodes—such as hospital feeders, water pumping stations, and emergency command centers—rather than attempting blanket system redesigns.
Recovery Throughput and Resource Allocation Constraints
Restoring power to 180,000 customers is a logistics optimization problem constrained by physical access, resource availability, and safety protocols. The speed of grid recovery is governed by the principles of network topology and triage prioritization.
[Initial Impact] -> [Damage Assessment Phase] -> [Transmission & Substation Repair] -> [Primary Feeder Restoration] -> [Lateral & Transformer Clearing] -> [Individual Service Drops]
The Triage Hierarchy
Repair crews do not deploy randomly; they operate according to a strict cascading priority model:
- Critical Infrastructure: Power must first flow to facilities essential for public safety, including water treatment plants, emergency medical facilities, and communication hubs.
- Substations and Transmission Lines: Restoring a local neighborhood transformer is useless if the high-voltage transmission line feeding that sector remains severed. High-capacity lines clear first to maximize the downstream customer count per repair hour completed.
- Primary Distribution Feeders: These lines carry power from substations into specific communities. Repairing one feeder can restore service to thousands of accounts simultaneously.
- Lateral Lines and Service Drops: Individual lines feeding specific residential properties are addressed last, as the labor-to-customer-restored ratio is lowest at this tier.
Island Logistics Bottlenecks
Island jurisdictions face severe logistical friction during disaster recovery. Specialized heavy equipment, replacement utility poles, transformers, and bucket trucks cannot be rapidly driven across state lines. They must be shipped via maritime freight or air cargo. This creates a hard ceiling on initial resource mobilization rates.
Furthermore, road blockages caused by downed trees and localized flooding delay damage assessment teams. Until reconnaissance teams physically verify grid damage, dispatchers cannot accurately assign specialized crews or estimate precise restoration timelines. This information vacuum often generates public frustration, as aggregate outage numbers remain static while invisible logistics operations are mobilized behind the scenes.
Strategic Resilience Adjustments
Mitigating future mass outages requires shifting from a reactive repair model to a proactive resilience framework. Utilities must modernize their infrastructure architecture based on probabilistic risk models rather than historical weather averages.
Grid operators should prioritize decentralized generation assets, such as microgrids powered by localized solar arrays paired with battery energy storage systems. By breaking a monolithic grid into autonomous cells, local communities can maintain critical power even if the primary transmission spine fails.
Concurrently, vegetation management must transition from scheduled maintenance cycles to continuous, data-driven LIDAR monitoring that identifies hazard trees outside standard utility right-of-ways before storm events materialize.
Ultimately, measuring the success of disaster response is not determined by how fast power is turned back on, but by how effectively the underlying network absorbs environmental shocks without cascading into widespread systemic failure.

:max_bytes(150000):strip_icc()/lake-mead-173940030-5c25228846e0fb00014e8584.jpg)
